1. Summary
The long-term uranium price is the highest it has been since the series began in 1996, while Cameco’s shares stand 43% below their January peak. This part examines the market behind the price, and Part 2 turns to how to invest.
Demand is visible. 79 reactors with 86.6 GWe are under construction, and their first cores alone equal 6 to 9% of world requirements in the busiest years. None of it depends on artificial intelligence. Fuel is bought two to three years ahead, so the purchases for reactors connecting in 2029 and 2030 are being made now.
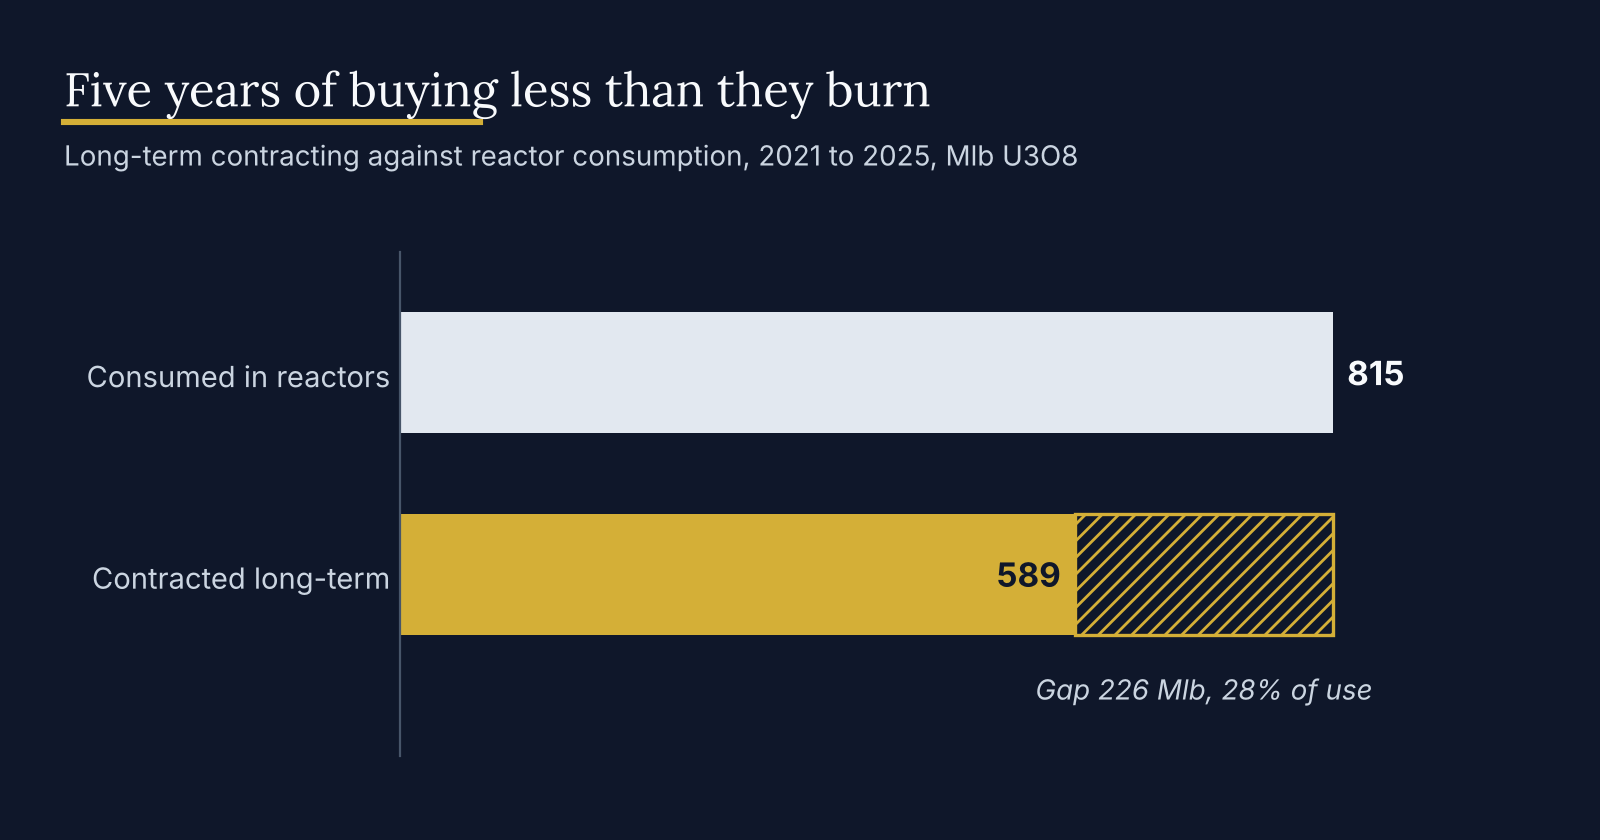
Utilities are not buying enough. Over the five years to 2025 they contracted 589 Mlb and burned 815 Mlb, leaving 28% of consumption uncovered. European cover falls to a maximum of 46% in 2033, and just over half of American needs for 2026 to 2035 are still unfilled.
Supply is slow to respond. Kazatomprom’s AISC has tripled since 2021, to $38.45/lb, and Cameco’s cost per pound of produced and purchased uranium rose 40% in the third quarter. New mines add 45 to 54 Mlb a year only from 2028. Conversion and enrichment are tight and partly Russian, and recycling pays only at a price far above today’s.
Stocks are a cushion, not a surplus. Western utilities hold two to four years of cover and are adding to it, so those pounds do not reach the market.
Spot should follow term. Spot stood at $89.63/lb at the end of September against $96.50 for the long-term price. In the episodes that resemble today, with term rising, spot closed the gap upwards, and the forward curve already prices $104 three years out and $111 five years out.
Uranium is too small a cost to change behaviour. Fuel costs $11.27/MWh in nuclear power, against $57.5 for coal, $232 for European gas and $18.8 for American gas, and the uranium alone is under 8% of the cost of generating a MWh. Utilities buy for security, and tend to do so late and all at once.
The risks are timing, a larger Asian stock than assumed, a supply response and a financial buyer that stays away. Chapter 8 lists what to watch.
2. Why now
Our coal report ended on nuclear as the slow alternative, and said that uranium would follow. This report is that follow-up, and the reason for writing it today is a disconnect that has opened up in the market over the past 9 months.
The price rises, the shares fall
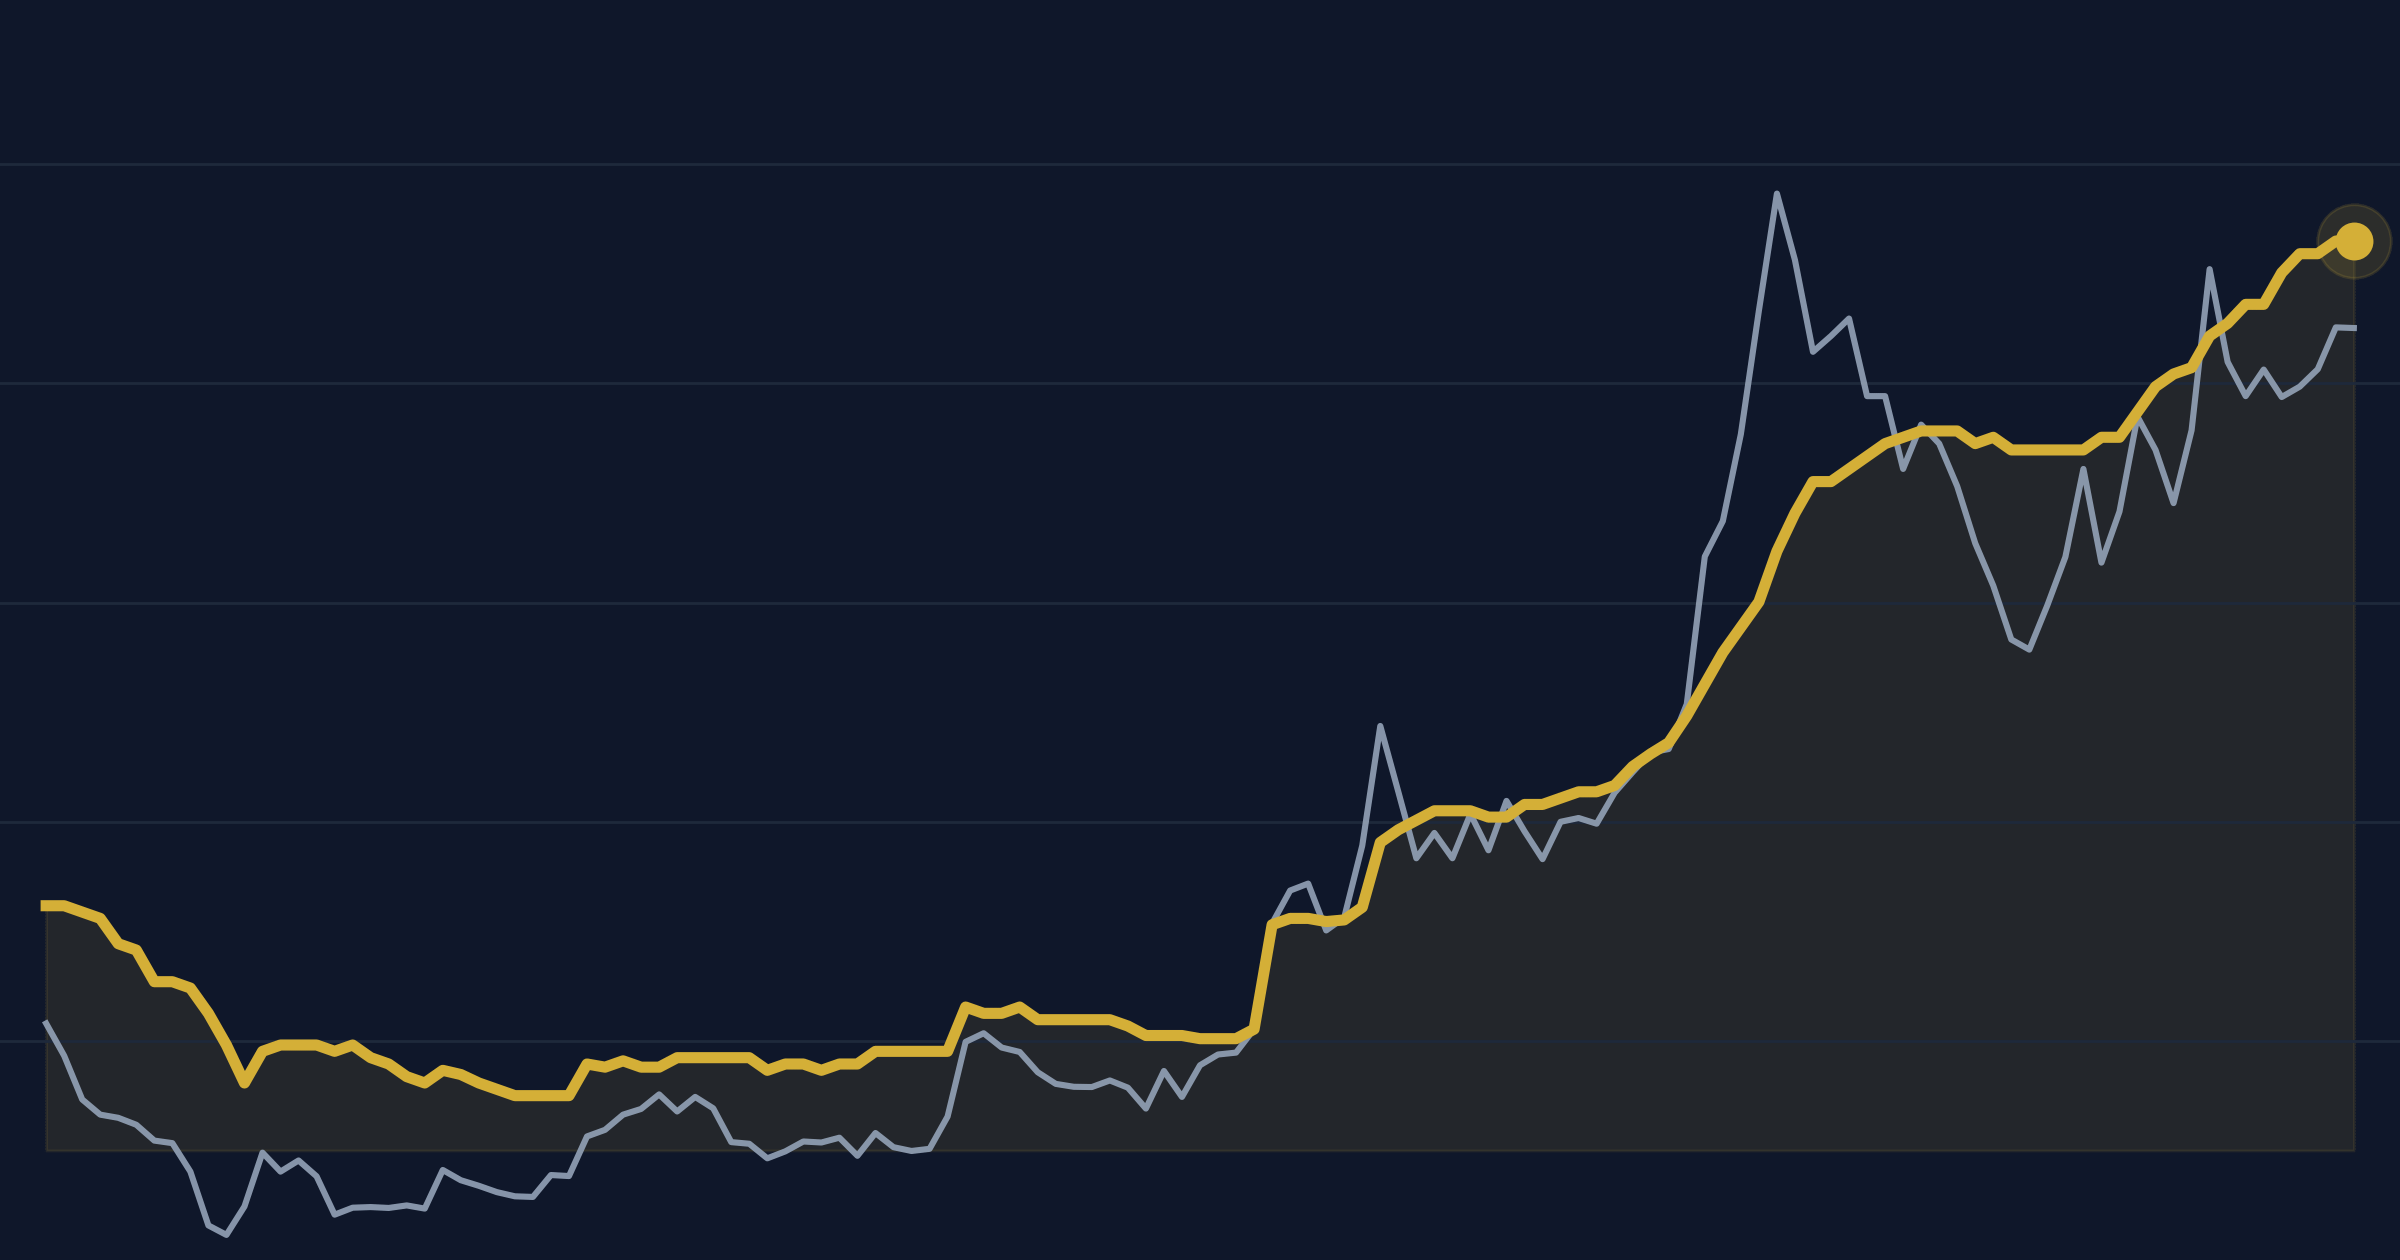
The long-term uranium price stood at $96.50/lb at the end of September, above the $95 of 2007 and the highest in Cameco's price series, which begins in 1996. Between the end of 2025 and the end of September it rose 11.6%, while spot gained 9.9% to $89.63.
The equities went the other way. Cameco closed at $134.09 on 28 January, its record, and at $76.91 on 30 October, 42.6% lower. Measured from the turn of the year, the shares are down 16% while the long-term price they sell into is up 12%. The largest uranium ETFs show the same pattern, with one-year returns of about minus 27% for URA and minus 26% for URNM in late October.
The vehicles that hold uranium itself are also out of favour. The Sprott Physical Uranium Trust, which owns 81.7 Mlb, traded 12.8% below the value of its holdings on 30 October. Over the third quarter it never once traded at a premium, in 63 trading days, against 16 of 62 days in the first quarter. A trust that cannot issue units at a premium cannot raise money to buy more uranium, so a source of spot demand has dried up.
Where the gap comes from
Part of the explanation lies in the mines. Prices have risen, but costs have risen faster. Kazatomprom’s AISC has tripled since 2021, Cameco’s cost per pound of produced and purchased uranium was 40% higher in the third quarter than a year earlier, and at Paladin the margin per pound fell from $25.8 to $17.8 even as the realised price went up. We take the supply side apart in Chapter 4.
The other part is the buyer. Utilities have not been signing contracts at the pace at which their reactors burn fuel, and spot has stood below the long-term price since October 2025, with a single exception in January. Term contracts are where utilities buy, and the long-term price shows where the pressure is building.
What this report does
The chapters that follow set out the market. We look at what the reactors need and what utilities have secured, what the mines can deliver and at what cost, how much uranium sits above ground, how spot, term and forward prices relate, and how uranium compares with gas and coal. The last chapter lists the risks and what to watch.
Part 2 turns to how to invest, through physical vehicles, funds and companies, with price scenarios of $80, $100 and $120/lb in the same format as the coal report.
3. Demand and contracting
Nuclear is slow to build, yet its fuel is committed years ahead. This chapter puts numbers on both, and on what the reactors that are coming will need.
The fleet and the pipeline
On the World Nuclear Association’s latest count, 443 reactors with 405.7 GWe of net capacity are operable. A further 79 reactors, 86.6 GWe gross, are under construction in 16 countries. China alone accounts for 38 of them, followed by India with 8 and Russia with 7. Note that the bases differ between sources. The independent World Nuclear Industry Status Report counts 411 operating reactors and 73 under construction, because it excludes units in long-term outage. We use the WNA figures throughout and label them as such.
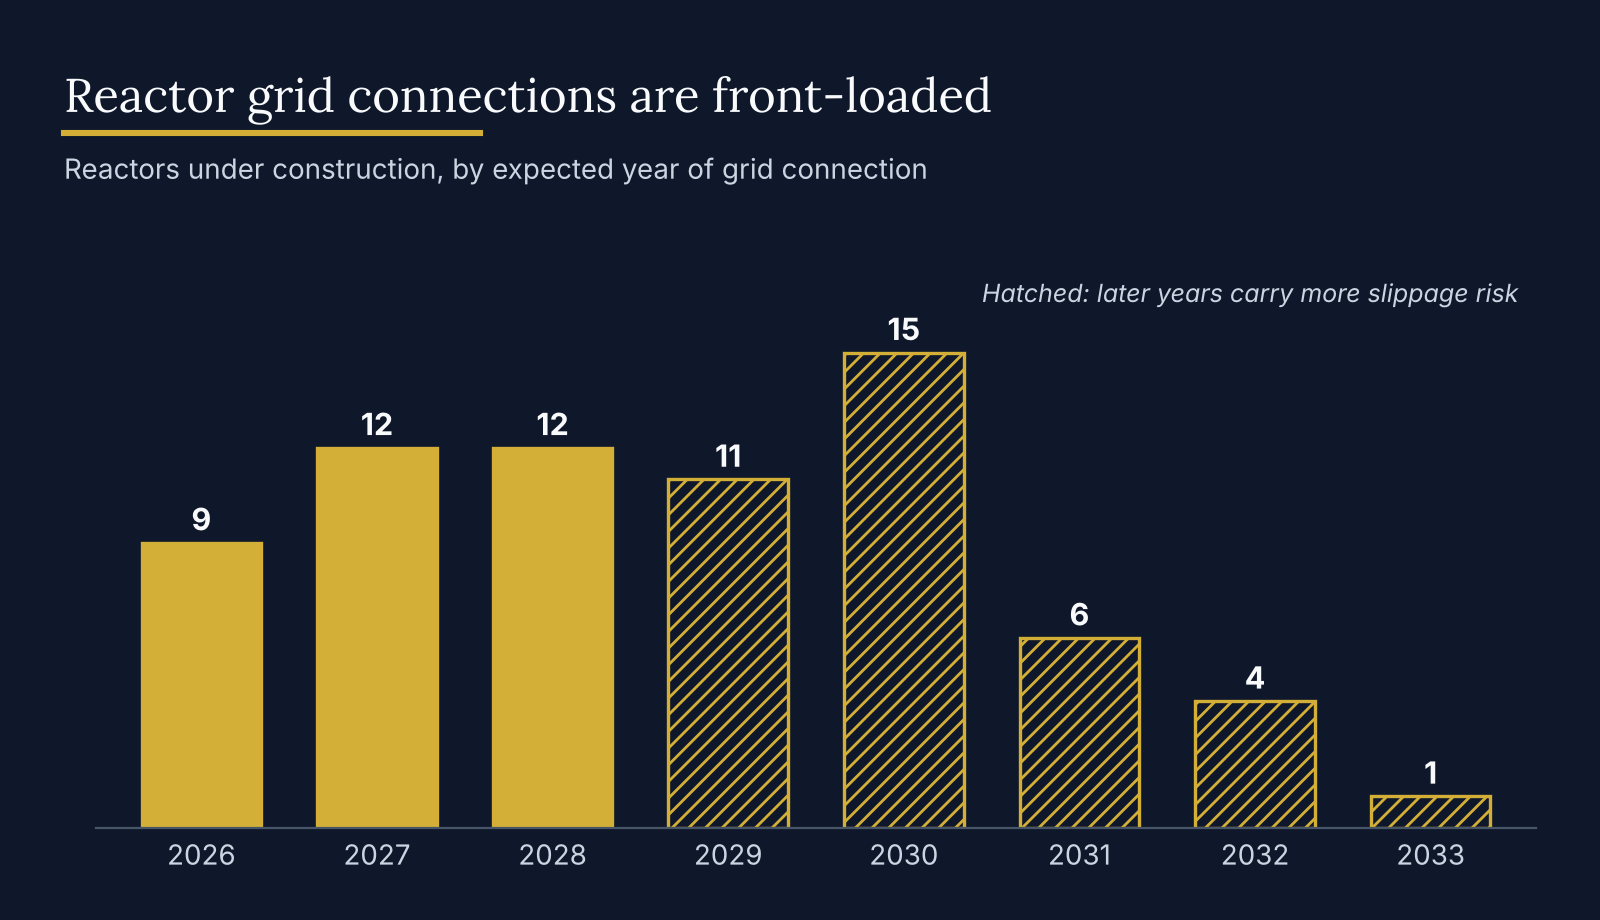
The WNA table dates about 70 of the 79 grid connections: 9 in 2026, 12 in 2027, 12 in 2028, 11 in 2029 and 15 in 2030, then a tail of 11 over 2031 to 2033. The remaining reactors are suspended with no date, among them units in Japan, Ukraine, Brazil and Argentina.
What a new reactor needs before it starts
A reactor does not buy fuel in its first year like an existing one. A new GWe needs roughly 300 to 450 tU for its first core, against about 150 tU a year for reloads thereafter. The first core is two to three times a year's reload, and it has to be bought, converted, enriched and fabricated before the reactor can start.
We can show what that means for the current pipeline:
86.6 GWe under construction × 300 tU = 25,980 tU, or 67.5 Mlb U3O8
86.6 GWe under construction × 450 tU = 38,970 tU, or 101.3 Mlb U3O8
Average unit size 86.6 / 79 = 1.1 GWe, so 12 connections a year is about 13 GWe, or 10 to 15 Mlb a year of first-core demand
World reactor requirements are about 180 Mlb a year, so first cores alone equal 6 to 9% of annual requirements in the busiest connection years. This is demand that is already visible, and none of it relies on reactors that are merely planned.
The lead times matter as much as the volume. Utilities typically contract two to three years ahead of delivery, and the physical journey from mine to reactor can take up to 18 months. A reactor connecting in 2029 therefore has to have its fuel largely secured during 2026 and 2027, which is now.
Demand that does not depend on AI
As some of you may now, we are a bit skeptical that the demand from AI will be as large as some actors try to make it seem. Luckily enough, none of the demand above rests on it. The reactors in our count are already being built, and their first cores and reloads will be needed whether or not data centres consume what the forecasts assume. Mines already fall short of requirements, as Chapter 4 shows, without a single AI-driven reactor in the numbers. Cameco, the largest Western producer, makes the same point: data centres can add meaningful upside, but they are not the foundation of the case, and they need power sooner than most large reactors can be delivered.
Policy points in the same direction. 38 countries, China among them since March 2026, have endorsed the goal of tripling global nuclear capacity by 2050. In October 2025 the US government agreed a partnership to support at least $80bn of new Westinghouse AP1000 reactors. Japan has restarted 15 reactors since 2011, most recently Unit 6 at Kashiwazaki-Kariwa, one of the world's largest nuclear plants, in January 2026, and Tomari is expected back in early 2027. None of this is in the construction count above, so it adds to demand rather than explaining it.
Why the build times matter
Two numbers are often quoted for nuclear construction: six to ten years, and decades. Neither is quite right, and the data lets us settle it. The WNISR 2026 puts the mean construction time for the 16 reactors connected over 2023 to 2025 at 10.9 years, and none of them were on schedule. The WNA’s own count for 2024 gives a mean of 114 months, with a median of 103. Chinese units are the exception. China has averaged about six years, against about nine globally over 2012 to 2021. Flamanville-3 in France arrived 12 years late.
So the honest range is about six years for the best builders and about ten for the rest of the world, with slippage common.
Capacity also leaves. Taiwan disconnected on 17 May 2025, a unit that supplied about 3% of the island’s electricity, and worldwide 2025 was a standstill: roughly 3 GW connected against roughly 3 GW retired, two thirds of it in Belgium.
Lifetime extensions point the other way. More recently Spain renewed the licence of the Almaraz plant until June 2030, and EDF extended the lives of Heysham 1 and Hartlepool in the UK by two years to March 2030.
Contracting has run below replacement for fourteen years
The demand side is only half of the story. The other half is whether utilities are securing the uranium. They are not at least not at the rate they burn it.
Over the five years to 2025, utilities placed about 589 Mlb under long-term contracts while their reactors consumed about 815 Mlb. We can show the working:
815 − 589 = 226 Mlb not replaced, or 28% of consumption
226 / 5 = about 45 Mlb a year left uncovered
2025 alone brought about 116 Mlb, which still covered only about 64% of annual requirements of 180 Mlb